Analyze That vs 48 Hrs.
48 Hrs.vsAnalyze That
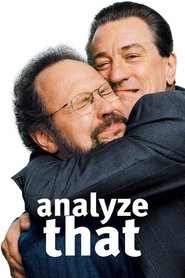

Analyze That and 48 Hrs. are neck and neck today.
0.6Jul 15 – Aug 13, 2022
All-time peak2.2Mar 5 – Apr 3, 2021
Attention Score is Television Stats' daily index of how much attention a show, movie, or person is getting across the web. Higher means more people are paying attention that day.televisionstats.com
By current Attention Score, Analyze That is the most popular at 0.4, followed by 48 Hrs. at 0.4. 48 Hrs. has the highest Peak Attention Score at 2.2 during Mar 5 – Apr 3, 2021.