
PBS
Wednesday, Nov 4. Out of 139 networks.
Attention Score measures how much attention a show gets online each day. A typical #1 show scores 100. A network's share is its part of the total for all current shows. How it works
Top PBS shows yesterday
Ranked by Attention Score
- 2
 Finding Your Roots#965 of all TV shows 2980.7
- 3
 This Old House#1,114 of all TV shows 1830.5
- 4
 NOVA#1,190 of all TV shows 7600.5
- 5
 The American Revolution#1,287 of all TV shows 1800.4
- 6
 Frontline#1,415 of all TV shows 8180.4
- 7
 American Experience#1,438 of all TV shows 3130.4
- 8
 America's Test Kitchen From Cook's Illustrated#1,727 of all TV shows 3270.3
- 9
 PBS News Hour#1,771 of all TV shows 4130.2
- 10
 The Vietnam War#2,046 of all TV shows 2340.2
- 11
 Rosie's Rules#2,097 of all TV shows 1650.2
- 12
 Washington Week with The Atlantic#2,702 of all TV shows 720.1
- 13
 The Mind of a Chef#2,944 of all TV shows 290.0
Advertisement
PBS's share of TV attention
By month, against its closest rivals
Network ranking this week
Last 7 days against the 7 before, through Nov 4




New seasons
Premiered in the last 60 days

Coming soon
Season premieres, soonest first
Biggest PBS shows ever
By each show's best 30 days in a row since 2015
 #786The American RevolutionNov to Dec 2025
 #1,403The Vietnam WarSep to Oct 2017
 #2,108MaigretOct to Nov 2025
 #2,370This Old HouseApr to May 2017
 #2,572NOVAFeb to Mar 2016
 #2,663Finding Your RootsJan to Feb 2023
 #2,681PBS News HourJan 2020
 #2,804America's Test Kitchen From Cook's IllustratedJan to Feb 2017
 #2,822FrontlineSep to Oct 2026
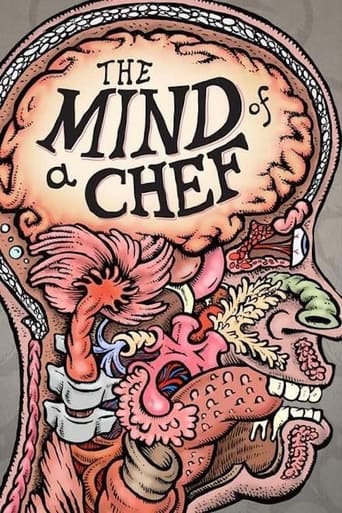 #2,850The Mind of a ChefAug 2015
PBS's biggest show each year
With its rank among all TV shows that year
* So far this year